
Summary
An employee saves two hours preparing a report. The report then waits three days for review before anyone reads it. A marketing team doubles content production while conversion quietly declines, because the extra content never had a clear audience. Both teams can point to a real productivity gain. Neither one can point to a business result that improved.
Artificial intelligence (AI) productivity measures show you how the speed, volume, and effort of work changed. Business outcome measures show you whether any of that improved revenue, conversion, quality, risk, or customer performance. You need both, and neither one on its own tells you what happened.
McKinsey found that 88 percent of surveyed organizations used AI in at least one business function during 2025. Only 39 percent reported any enterprise-level earnings impact. Deloitte found that 66 percent of organizations had achieved productivity or efficiency gains. Only 20 percent reported current revenue growth, and only 38 percent reported stronger customer relationships, the lowest-ranked benefit in its survey. None of that reduces the value of productivity. It shows why you need a system connecting task-level improvement with the operational and financial result it was meant to produce.
Two different measures, two different jobs
Productivity measures sit close to the task. Time saved, outputs produced, tasks completed, active users, workflow adoption. They tell you whether AI is performing its intended function. They can also expose weak adoption, expensive model use, or low employee confidence long before you notice it any other way. A content team can measure drafting time. A salesperson can measure account research time. What neither one can tell you is whether the business got better, because that was never the question they were built to answer.
Business outcomes are the reason the workflow got funded in the first place: revenue, conversion, margin, retention, quality, risk reduction. An account research workflow earns its keep by helping a sales team identify and convert better opportunities, not by producing a lot of reports. A customer service assistant earns its keep by helping customers reach real resolutions, not by drafting responses fast. Speed was never the point. It was always a means to something else.
Why you need to pair them
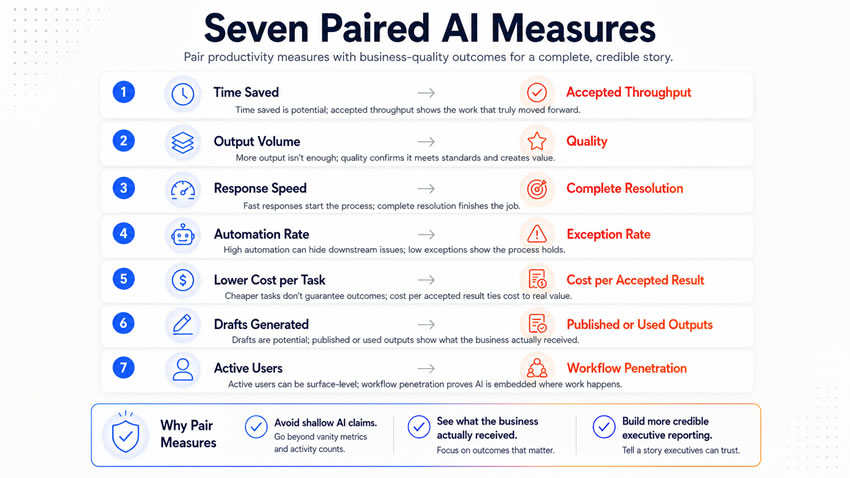
Report productivity alone, and you reward activity without proving anything. Report outcomes alone, and you can see that something moved without ever knowing why. The fix isn’t picking a side. It’s making sure every speed or volume number sits on the same page as the result it was supposed to produce.
Take time saved. On its own it tells you a task got faster. Put it next to accepted throughput, and you find out whether that faster work was usable, or whether it moved the correction burden downstream instead. A draft that saves 90 minutes and then needs an hour of editing has not saved 90 minutes at all.
Output volume works the same way. A team can generate a thousand pieces of content and call that a win. Volume alone tells you nothing about whether the content clears the bar. Put quality next to it, and you will often find a single serious failure hiding inside an otherwise impressive pile of output. That is the number that matters.
Active user counts can look great in a slide and still hide a real problem. Most of the eligible work is still running through the old process untouched. What you want next to it is penetration, the percentage of real work flowing through the new tool rather than around it.
A high automation rate sounds like progress until you check what’s happening to the exception rate at the same time. If exceptions are climbing while automation looks strong, the “normal path” the system handles is a lot narrower than the headline number suggests.
Response speed has the same trap. Answering a customer fast feels good, but a fast first response can still leave them doing all the real work themselves to get resolved. Put resolution next to speed, and you will see whether the need got met or only acknowledged.
Research time and conversion belong together for a similar reason. Faster research only matters if it led to a better decision. If your team’s research time keeps dropping and conversion sits there, flat, the time savings never turned into anything a deal depended on.
Cost per task needs total business value sitting right beside it too. Task-level efficiency says nothing about the complete picture: revenue, cost, risk, and customer effect all together. A cheaper task can still be a worse investment.
Reading the whole chain, not one link
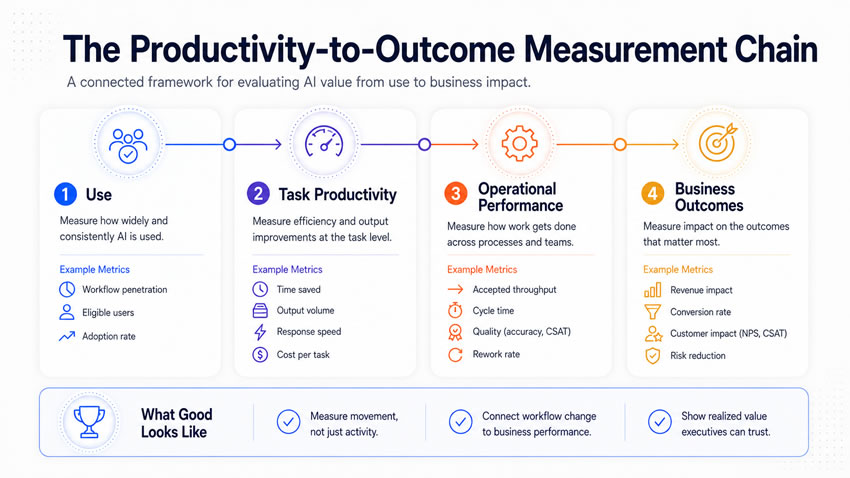
There are four layers here, and reading them in order is how you diagnose what is wrong instead of guessing. Use and adoption tells you whether people are even touching the tool: eligible users, penetration, acceptance rate, latency, cost. Productivity tells you how the individual task changed. Operational performance tells you how the complete process runs, cycle time, accepted throughput, rework, backlog. Business outcomes tell you whether any of it mattered: revenue, conversion, retention, risk, quality.
Low adoption almost always means an enablement problem, not a technology problem. If adoption is strong but productivity is weak, the workflow itself is probably designed badly. If productivity looks great but accepted throughput doesn’t move, you’ve got a quality or review bottleneck eating the gains. If throughput is strong but conversion never budges, the problem is not the AI at all. It is targeting, sales execution, or product fit sitting downstream of it. Each layer explains the one above it. That’s why no single number, reported by itself, ever tells the whole story.
Give saved time somewhere to go
Saved time is potential, not proof. Preparation work can quietly eat part of it. Review can shift the labor onto someone else, an editor now spending an hour on a draft that saved the writer 90 minutes. Rework can show up weeks later during legal or customer review, long after anyone credited the time savings. Plenty of small savings scattered across someone’s day never combine into anything usable.
Name where the freed time is supposed to go before you claim it as a win. Absorbing more demand. Improving quality. Shrinking a backlog. Giving people more time with customers. Until that destination is named, it’s a claim, not a result.
Watch the gap between generated and accepted
The same discipline applies to volume. A system might generate a thousand assets. Of those, maybe 400 get accepted, 250 enter use, and 30 ever produce a result anyone cares about. Report the thousand, and you are telling a story that is technically true and practically misleading.
Revenue, risk, and customer measures each need their own honesty
Revenue attribution has to separate what the workflow can trace directly from what it merely supported alongside other factors. It also has to separate opportunity it created but has not closed from revenue it protected through retention. Risk reduction creates real value that never shows up as revenue at all, incidents prevented, exposure avoided. It deserves comparison against a genuine historical baseline, not a hypothetical worst case dressed up to look impressive. Customer measures need to look past satisfaction scores. A customer can report being satisfied while quietly experiencing the exact delays a resolution-time number would have caught.
Decide attribution and cost before launch
Wait until a workflow is already live, and the comparison data you needed is usually gone. Controlled testing, staggered rollout, matched cohorts, before-and-after analysis, all of it works. Pick the method before launch instead of trying to reconstruct one afterward. McKinsey recommends building attribution into implementation directly rather than relying on estimates later.
Cost has to sit beside every benefit claim the same way. A workflow that saves 100,000 dollars in labor while costing 80,000 dollars to run is still a win. It’s a much smaller one than the headline number makes it sound.
Match ownership to what’s being measured
A workflow owner explains cycle time, throughput, and exceptions. A technical owner explains latency, failures, and model cost. The business result belongs to whichever sales, service, marketing, or finance leader already owns it. That leader has to validate the claim rather than letting the AI team hand itself credit for someone else’s number. A dashboard nobody can explain is a report, not a management tool.
Build the first paired scorecard in about a month
Start by naming the business problem the workflow was built to solve. Pick one primary outcome, and record the baseline, source, and owner before touching anything else. From there, map the full chain, use, productivity, operations, outcome, and assign a source and an owner to every measure. Drop anything that cannot support a decision.
Once that is mapped, pick your attribution method and write down what else could be influencing the result. Build one honest cost record covering licenses, review, support, and maintenance. Then run the first real review against the baseline. Check the gains, the corrections, the labor that got transferred somewhere else, and the customer or risk effects. Decide, from there, whether to expand it, fix it, narrow it, pause it, or kill it.
Productivity tells you how the workflow changed. Business outcomes tell you whether the change was worth having. You need both stories running together on the same page. A productivity number sitting alone is a claim waiting for evidence, and the organizations getting real value from AI in 2026 stopped letting it wait.