Summary
Most business-to-business (B2B) marketing teams already collect strong buying signals. Email clicks, website visits, advertising engagement, webinar attendance, and intent data all arrive every week. The data exists, yet the sales team rarely receives it as something it can use.
The distinction is simple. Campaign engagement tells you what happened. Sales intelligence helps a person decide what to do next.
I have watched this gap play out inside real revenue teams. Marketing forwards a list of engaged contacts, and sales cannot tell which accounts are actually moving. The signals are present, and the interpretation is missing.
Artificial intelligence (AI) earns its place at exactly this point. It becomes valuable when it helps a team consolidate, compare, classify, and route scattered signals into sales-ready intelligence.
Why B2B Signal Quality Breaks Down
Signals usually live across disconnected systems. Email engagement sits in one tool, advertising engagement sits in another, and website behavior sits somewhere else. Intent data adds a further layer, and sales activity lives inside the customer relationship management (CRM) or sales engagement platform.
This fragmentation is common even where adoption is mature. McKinsey’s 2025 State of AI report found that marketing and sales remain among the most common business functions using generative AI. That matters because many teams already have tools and data in motion, while the operating system around those signals remains underdeveloped. McKinsey & Company
The breakdown usually traces to five causes.
- The same company appears under different names across different tools.
- Contacts engage individually, yet the account-level story stays unclear.
- Weekly reports show activity, yet they rarely show change over time.
- Sales receives contacts without enough context to act on them.
- Marketing cannot easily separate idle curiosity from real buying movement.
Each cause is operational rather than strategic. The weakness is rarely technology alone. Many useful signals already exist, but the system that turns them into meaning is incomplete.
What GTM Signal Intelligence Actually Means
Go-to-market (GTM) signal intelligence is the practice of turning marketing, sales, and intent activity into account-level insight. That insight then supports prioritization and follow-up rather than another dashboard.
A strong signal system answers a specific set of questions every week.
- Which companies engaged during the past week?
- Which companies are newly active, returning, or increasing in activity?
- Which companies engaged across more than one source?
- Which companies match the ideal customer profile (ICP)?
- Which contacts or roles appear connected to the activity?
- Which accounts deserve sales follow-up right now?
- What should the seller say when they reach out?
Those questions form the bridge from raw reporting to business action. A team that answers them weekly has built sales intelligence, not a report.
The GTM Signal Intelligence Workflow
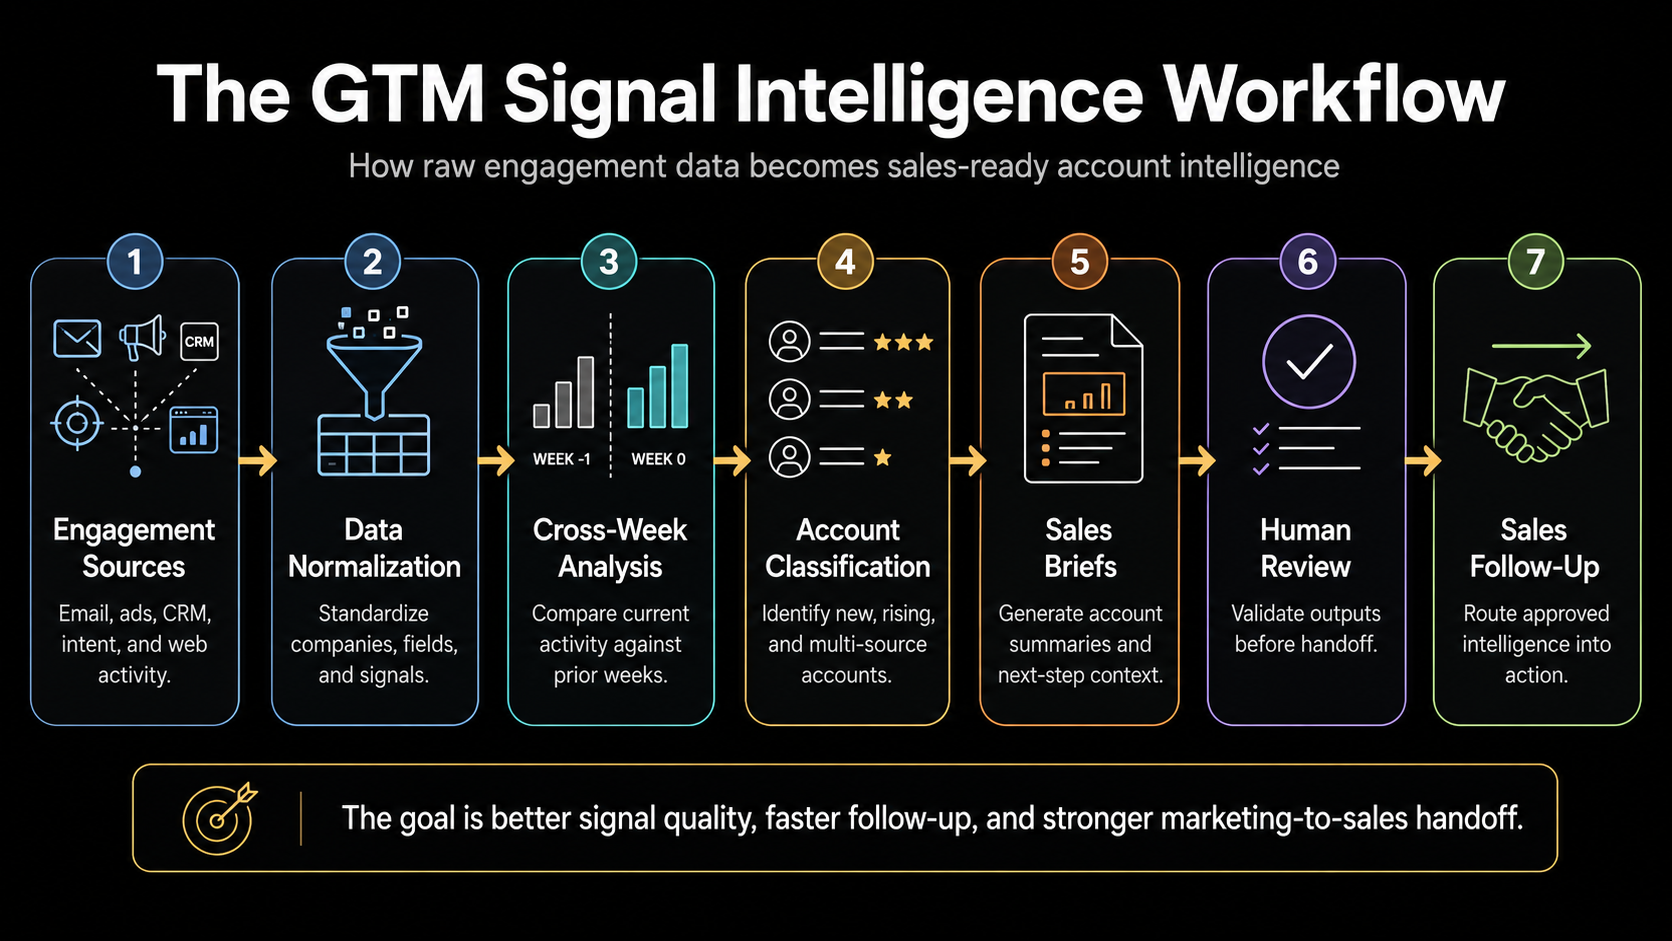
The GTM Signal Intelligence Workflow is the weekly system that converts raw engagement into trusted sales follow-up. It runs in seven stages, and it follows the familiar Signal, Decision, Execution arc that disciplined revenue teams already understand.
The first two stages capture the signal, the next two turn it into a decision, and the final three carry it into execution. The workflow improves over time, because feedback from sales sharpens the classification rules each week.
Stage One: Engagement Sources
The workflow first pulls activity from the systems where signals already live. The goal is coverage across the channels that reveal account interest.
- Email opens, clicks, and unique engagement provide the first layer.
- Sales engagement activity shows direct seller-to-buyer contact.
- CRM records supply account history and ownership.
- Advertising engagement, including LinkedIn, shows paid reach.
- Website visits and intent topic activity show research behavior.
- Existing account notes and prior weekly reports supply continuity.
Stage Two: Data Normalization
The workflow then standardizes company names, domains, source labels, dates, campaigns, contacts, and engagement types. This step is unglamorous, and it determines whether everything downstream holds together.
One point deserves emphasis here. Artificial intelligence cannot repair weak data structure on its own. The system still needs consistent fields, clear naming rules, and a documented data dictionary that people maintain.
Stage Three: Cross-Week Analysis
The workflow next identifies movement by comparing current activity against prior weeks. A single week of engagement is a snapshot, and change over time is the actual signal.
- Newly engaged accounts show fresh interest worth noting.
- Re-engaged accounts show renewed attention after a quiet period.
- Increasing-intent accounts show a rising pattern across sources.
- Multi-source accounts show engagement in more than one channel.
- Dormant and high-fit accounts show where attention has faded.
Stage Four: Account Classification
The workflow then applies decision rules so that activity becomes a recommendation. Discipline matters at this stage, because only a portion of weekly signals should ever become a sales task.
A simple classification model uses five outcomes. An account can move to monitor, to research, to nurture, to sales, or to escalation for account review. Each outcome carries a clear reason, which is what lets a reviewer trust it.
Stage Five: Sales Briefs
The workflow then turns the classified accounts into outputs a person can act on. The briefs translate analysis into context rather than raw numbers.
- A weekly executive summary frames the overall picture.
- A prioritized account list shows where to focus first.
- New and updated sales briefs give context for each account.
- Recommended next actions and talking points guide outreach.
- Data quality warnings flag anything the team should not trust yet.
Stage Six: Human Review
A reviewer then checks the briefs before anything reaches a seller. This review point is the difference between responsible AI and automated guessing.
The reviewer owns final interpretation, especially when outreach timing, account priority, or claims about a customer are involved. The system recommends, and a person decides.
Stage Seven: Sales Follow-Up
The seller then acts on the approved brief with context already in hand. The follow-up is faster and more relevant because the groundwork is done.
This stage also closes the system. Feedback on which accounts converted returns to the classification rules, so the workflow gets sharper each week.
A practical example shows how the stages combine. Imagine a company that clicked an email, visited two service pages, appeared in intent data, and reappeared after several quiet weeks. None of those signals proves buying intent by itself. Together, they justify a reviewed sales brief that explains the activity, identifies the likely topic of interest, and recommends a thoughtful follow-up.
Where Artificial Intelligence Helps Most
Artificial intelligence is strong at synthesis, comparison, summarization, classification, and draft generation. It compresses hours of manual sorting into minutes of structured output that a person can verify.
Its strongest use cases are clear. It summarizes account activity, compares engagement week over week, flags unusual changes, drafts sales briefs, and turns messy notes into structured context.
The limits are equally clear. Artificial intelligence weakens when the source data is inconsistent, when context is missing, or when the information is too sensitive for the tool in use. The human reviewer still owns final interpretation, especially when outreach timing, account priority, or claims about a customer are involved.
The Sales Brief Is Where Marketing Intelligence Becomes Useful
Most teams stop at a dashboard. The stronger move is to convert signals into a usable sales sheet that a seller can act on without further research.
What a strong sales brief contains
- A company overview and relevant market context.
- The observed engagement signals for the week.
- Known contacts and likely buying committee roles.
- The campaigns or topics the account engaged with.
- A short history of prior activity.
- Possible pain points and a suggested outreach angle.
- A recommended next action.
- Review notes and a confidence level.
A sheet like this turns analysis into action. It also gives sales a reason to trust the handoff, which is the point at which most marketing-to-sales systems quietly fail.
The Operating Model Behind the Workflow
A workflow without an operating model becomes a clever experiment that no one maintains. Durable signal intelligence needs ownership, cadence, governance, and an improvement loop.
The operating model should define a clear set of responsibilities and rules.
- It names who exports or connects the data each week.
- It specifies where the weekly files live and how prior weeks are stored.
- It lists the required fields and the approved data sources.
- It records which AI prompts are approved and who reviews the output.
- It sets where reports and sales briefs are saved.
- It defines how sales feedback improves the model over time.
- It schedules when the whole workflow gets reviewed.
This is the layer that connects a single weekly task to a broader Marketing AI Operations practice. The workflow produces value, and the operating model makes that value repeatable.
What Leaders Should Measure
Measurement keeps the system honest, and it should track effort, output, and usefulness rather than vanity. Treat the following as suggested measures rather than guaranteed outcomes, since results depend on data quality and sales adoption.
- Time saved in weekly analysis shows operational efficiency.
- The number of accounts reviewed and sales-ready accounts identified shows coverage.
- The share of accounts with multi-source engagement shows signal strength.
- Sales acceptance of recommended accounts shows trust in the system.
- Meeting conversion from AI-assisted follow-up shows downstream value.
- Reduction in duplicated research shows that the repository is working.
- Improvement in follow-up speed shows the system is shortening response time.
A 90-Day Implementation Roadmap
Many teams can stand up a first working version in roughly 90 days when the data sources, ownership, and review process are clear. The early weeks build the foundation, and the later weeks build the discipline.
- In the first 30 days, the team maps sources, defines data fields, documents the current manual process, identifies failure points, and creates the first account-level report format.
- From day 31 to day 60, the team automates data consolidation, tests AI prompts, compares weekly outputs, defines sales-readiness categories, and creates the first sales brief template.
- From day 61 to day 90, the team adds routing, establishes human review rules, measures sales usefulness, refines the classification model, and documents the workflow in a central repository.
Common Failure Points
Most failures are predictable, and naming them in advance prevents them.
- Teams treat every engagement signal as buying intent.
- Teams send weakly qualified accounts to sales too quickly.
- Teams trust AI summaries without verifying the source data.
- Teams ignore company name and domain inconsistencies.
- Teams report current activity without comparing it against prior weeks.
- Teams produce reports that explain activity without guiding action.
- Teams let prompts live in private chats instead of shared documentation.
- Teams skip sales feedback after the handoff, so the model never improves.
The Strategic Implication
More dashboards will not help a team that never converts signals into action. The advantage comes from a repeatable system that identifies meaningful account movement, explains why it matters, and hands sales a useful next step.
The strongest revenue teams of the next few years will not be the ones with the most campaign data. They will be the ones that turn engagement into clear, timely, and trusted sales intelligence.
Key Takeaways
- Engagement data becomes useful only when it supports a clear sales decision.
- Artificial intelligence helps most with synthesis, comparison, classification, and draft generation.
- Weekly signal workflows should compare current engagement against prior account activity.
- Sales briefs turn marketing signals into practical follow-up context.
- Human review remains essential when artificial intelligence influences outreach decisions.
Frequently Asked Questions
What is AI sales intelligence? AI sales intelligence uses artificial intelligence to analyze business signals, summarize account activity, and support better sales prioritization.
How is campaign engagement different from sales intelligence? Campaign engagement shows what someone did. Sales intelligence explains whether the activity matters and what action should happen next.
Which marketing signals are useful for sales intelligence? Useful signals include email clicks, website visits, advertising engagement, webinar activity, CRM records, sales engagement, and intent data.
Should artificial intelligence decide which accounts sales should contact? Artificial intelligence can recommend accounts for review, and a human should approve outreach decisions in most B2B environments.
How often should teams review GTM signals? A weekly cadence works well for many B2B teams, because it supports timely follow-up without overreacting to daily noise.
Framework Reference: The GTM Signal Intelligence Workflow
Definition. The GTM Signal Intelligence Workflow is a weekly system that turns scattered marketing, sales, and intent activity into trusted, account-level sales follow-up.
Stages. Engagement Sources, Data Normalization, Cross-Week Analysis, Account Classification, Sales Briefs, Human Review, and Sales Follow-Up.
Application. Teams apply it by collecting from approved sources, normalizing the data, analyzing change across weeks, classifying sales readiness, generating briefs, routing them through human review, and feeding follow-up results back into the rules.
Source: McKinsey & Company. (November 2025). The State of AI in 2025: Agents, innovation, and transformation. https://www.mckinsey.com/capabilities/quantumblack/our-insights/the-state-of-ai