
Summary
Hours saved is the first number you will report in any artificial intelligence (AI) program, and it is rarely dishonest. It is safe. It needs no comparison group and no argument with another department about who gets the credit. It needs no admission that the workflow underneath the tool might still be broken. A timer is all it takes, and that safety is exactly what makes it worthless as evidence. It cannot tell you whether the business completed more real work or made a better decision. It says even less about whether the saved time moved into correcting outputs and chasing exceptions instead.
Deloitte found that 66 percent of surveyed organizations had achieved productivity or efficiency gains from AI, while only 20 percent reported increased revenue. McKinsey found that only 39 percent of surveyed organizations attributed any earnings impact to AI at all. Most of those reported less than five percent of earnings from AI use. Neither finding argues against productivity. Both explain why the gap between activity and outcome keeps showing up, quarter after quarter, in company after company. You need evidence connecting productivity to an actual business result, not only a faster first step. That is what the next ten measures give you.
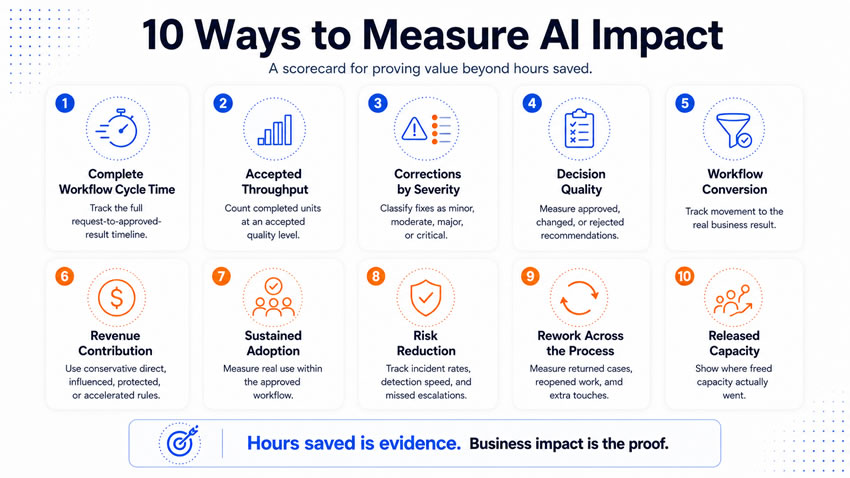
One: track the complete workflow cycle time
Watch what your teams celebrate. They love the moment a draft appears in seconds, and almost nobody watches what happens to it afterward. The drafting step gets faster while research, review, correction, approval, and distribution keep running at their old pace around it. You end up reporting the one number that improved and ignoring the four that did not move at all.
Start the clock when the request enters the workflow, not when generation begins. Stop it only when the intended recipient receives an approved result they can use. Track the median, since a handful of extreme cases will distort an average. Track the 90th percentile too, because that is where the real delays live. Watch what happens to those two numbers together. Production time typically drops while review quietly becomes the new bottleneck. That is exactly why MIT Sloan’s research on complete task sequences exists: individual task speed can hide friction sitting somewhere else in the chain.
Two: measure throughput at an accepted quality level
A content team can look dramatically more productive by volume while producing less usable work than before. The trap is subtle enough that nobody notices until someone reads the fifteenth draft. “Completed” has quietly come to mean “generated” in a lot of reporting, and those two words used to mean different things. Define completion honestly before you measure anything: an approved proposal delivered, a customer question resolved without reopening, a financial record reviewed and posted correctly.
A workflow creates real capacity when accepted output rises without a matching rise in labor, risk, or correction. Volume that rises only because more got generated, not completed, produces more work for someone else to finish rather than creating anything new.
Three: classify corrections by severity
Every workflow’s error rate gets collapsed into one reassuring percentage, and that percentage is quietly lying by omission. A typo and a legal exposure share the same bucket in most reports. The number that looks fine can be hiding the one error that matters. Give corrections a real classification instead of a blend. Minor changes touch formatting with no shift in meaning. Moderate changes touch wording or structure. Major changes alter a recommendation or a business action. Critical changes prevent legal, financial, or safety harm outright.
Track the pattern behind each level, not only the count, since the pattern is what tells you where the problem lives. Repeated factual corrections point to weak retrieval. Repeated tone corrections point to missing brand instructions. Repeated decision changes mean the workflow is being asked for judgment it cannot reliably supply. McKinsey found that nearly one-third of respondents had experienced negative consequences from AI inaccuracy. Defined human validation was what separated the organizations that avoided it from the ones that did not.
Four: check the quality of the decisions AI supported
A recommendation that arrives faster feels more trustworthy, and that feeling has nothing to do with whether the recommendation is right. Speed and quality are two entirely different variables, and you are probably measuring the first while assuming it proves the second. Decision quality needs an agreed standard before you measure it: expert judgment, a documented policy, or a later observable outcome.
Track how often reviewers approve, change, or reject a recommendation. Track how often leaders reverse a decision once new information appears. A sales prioritization workflow should check whether the accounts ranked highest produce more meetings and qualified pipeline. Look in both directions for error: time spent chasing weak opportunities, and good accounts that quietly got overlooked. Deloitte found that 53 percent of surveyed organizations reported better insights and decision-making from AI. That figure beat reported revenue gains by a wide margin. A person can still make the final call, and the decision can still improve, because the evidence in front of them got more complete.
Five: trace conversion across the workflow
A research assistant can genuinely change whether a meeting gets booked. It has almost no honest claim on revenue that closes six months later through people it never touched. That revenue keeps ending up in the same slide anyway. Match your conversion measure to the workflow’s actual result. A content visit becomes a qualified inquiry, a prioritized account becomes a booked meeting, and a first response becomes a resolved case.
Choose that point before the pilot begins, and keep it close enough to the workflow that the attribution stays honest. Compare AI-supported cases against a real comparison group whenever the volume allows it, whether other teams, other regions, or an earlier period. Control for everything else moving conversion at the same time: pricing, staffing, campaigns, seasonality. Report the confidence behind the number plainly, rather than crediting AI with every improvement that happened to occur after launch.
Six: attribute revenue contribution honestly
Revenue is the number every leader secretly wants. It is also the number most likely to get claimed dishonestly under pressure to show a return. Several teams usually touch any commercial result at once, and the workflow that drafted one email in the sequence rarely deserves the whole opportunity.
Direct revenue includes an offer a customer accepted outright because of the workflow. Influenced revenue includes opportunities that received AI-supported research or personalization along the way. Protected revenue covers renewals saved through earlier risk detection, and accelerated revenue covers deals that closed sooner because a proposal moved faster than usual. Use conservative rules, and subtract the complete operating cost, technology, review, maintenance, before you report anything net. McKinsey found reported revenue benefits appearing most often in marketing and sales, corporate strategy and finance, and product development. Revenue is a genuinely valuable measure when the workflow has a credible causal path to it. One overstated claim damages trust in the whole program faster than admitting the number is still soft.
Seven: confirm sustained adoption within the approved workflow
An employee can look perfectly compliant on a dashboard, an active account, regular logins, and still be running the old process privately underneath it. They have not decided yet that the new one is trustworthy. License activation and prompt volume both miss this completely, since neither one asks whether the person believed the output.
Real adoption means intended users completing real work through the approved process. It means returning to it 30, 60, and 90 days later, well past the launch week when everyone is still watching. Track the percentage of eligible cases processed through the workflow. Track approved overrides against unapproved workarounds too, along with cases quietly returned to the old process. Interview people directly about where the workflow creates hesitation, since the honest answer rarely shows up in the usage logs. McKinsey identifies adoption and scaling as one of six dimensions tied to real AI value, alongside strategy, talent, operating model, technology, and data.
Eight: prove risk reduction
The incident that never happened is invisible on every dashboard your company builds. That is exactly why risk reduction gets undervalued relative to almost anything else AI touches. “Improved compliance” sounds like progress and measures nothing, since it names no specific event, no likelihood, and no actual control behind it.
Give your real measure all three: fewer policy violations, faster detection of unusual transactions, faster escalation of privacy concerns. Track incident count and severity before and after deployment, along with time to detect and time to contain. Some of what got avoided is genuinely hard to prove directly. Lean on historical incident rates and control testing to build a credible estimate rather than a guess. The National Institute of Standards and Technology’s (NIST) Artificial Intelligence Risk Management Framework organizes this work around governing, mapping, measuring, and managing. It exists for exactly this reason. Watch for the risk the workflow quietly introduces too. A system that reduces manual errors can create new data exposure or excessive trust in its own output with equal ease.
Nine: track rework across the full process
Think about a proposal that gets rebuilt after approval, or a customer case that reopens because the first answer was incomplete. It rarely gets counted as a failure of the workflow. It gets counted as one more thing an individual employee had to redo, and that framing hides exactly where the real problem lives.
Rework is different from correction. Correction fixes one output. Rework measures the whole workflow repeating itself, and it deserves its own tracking through returned cases, reopened records, and the extra labor each one creates. Track the percentage of cases requiring rework, the average number of touches per completed case, and the stage where rework most often begins. That stage is usually the real diagnosis: weak inputs driving repeated generation, unclear approval criteria producing conflicting reviewer requests, disconnected systems forcing manual re-entry. MIT Sloan research notes that a single difficult task and repeated human handoffs can weaken an entire workflow chain. Reducing rework often creates more value than raising raw output ever could. The improvement reaches several people and several systems at once instead of only one.
10: find where the released capacity goes
An employee finishing a report two hours early has not created two hours of value. They have created two hours of potential, and potential left undirected tends to quietly refill with whatever was already crowding the calendar.
Released capacity can absorb more demand, give experts more time on difficult cases, or shrink a backlog. That only happens if you name the destination before the workflow launches, not after. Track the capacity confirmed through actual workflow data, the roles receiving it, and the business result connected to the redirected work. Resist converting every released hour into an assumed salary saving. Salary expense usually stays on the books unless the company reduces staffing or avoids a hire. MIT Sloan research notes that AI can free employees for more judgment-based, higher-value work. That shift only becomes real once someone in the business points it somewhere on purpose.
Build your scorecard around five things
Bring five things together, because none of them tell the truth alone. Put the primary business outcome beside workflow performance, measured through cycle time and throughput, and quality and control, measured through corrections and rework. Add adoption and its effect on the workforce, alongside financial performance against the complete operating cost. Attach a baseline, a target, a data source, a named owner, a review frequency, and an action threshold to every measure. Without a response attached, your scorecard is a report nobody is accountable for acting on.
Watch these measures in combination, not isolation
The real story only shows up once you put these numbers next to each other. Cycle time improving while rework climbs means outputs are moving faster while downstream teams spend more time fixing them. Throughput rising while conversion falls means more activity is happening without more progress toward the result that mattered. Adoption growing while corrections stay high means employees are genuinely using the system. Quality control is quietly absorbing the capacity it was supposed to free up. Revenue improving alongside rising risk events means the workflow is creating commercial value the company never agreed to accept that exposure for.
Do not measure these alone
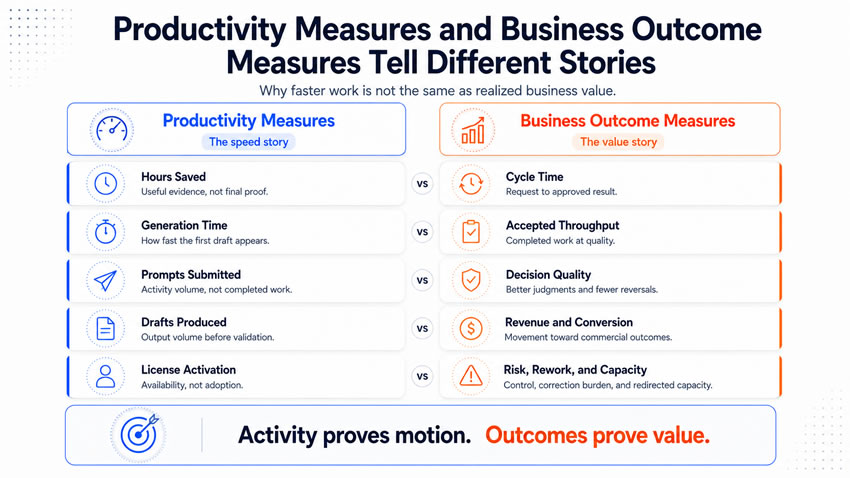
License counts, training attendance, prompts submitted, documents generated, and employee-estimated hours saved all describe availability or activity, not results. None of them prove the business improved. Your company can generate a great deal more material while quietly creating more correction, confusion, and risk at the same time.
Run this 30-day measurement setup
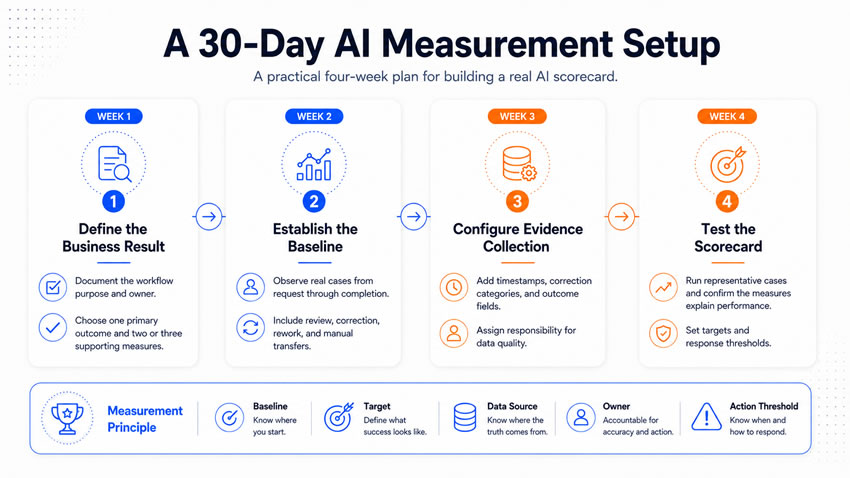
Week one. Define the business result. Document the workflow’s purpose and owner, then select one primary outcome and two or three supporting measures.
Week two. Establish the baseline. Observe several real cases from request through completion, including review, correction, rework, and manual transfers.
Week three. Configure evidence collection. Add timestamps, correction categories, and outcome fields to the operating systems, and assign real responsibility for data quality.
Week four. Test the scorecard. Run representative cases, confirm the measures explain performance, and set targets and response thresholds before you call it done.
What you tell them at the end
Faster task completion is one piece of AI’s value story, and it was never the complete one. Treating it that way is how a genuinely useful technology ends up measured like a stopwatch instead of a business investment. You need evidence on correction, decisions, conversion, revenue, adoption, risk, rework, and redirected capacity. That is what places productivity inside a real operating story instead of a demo. The strongest AI programs can say what improved, what that improvement required, and where the resulting capacity finally landed. All of it comes from evidence pulled out of real work, not a stopwatch running in the background.