
Summary
You already know this scene. You are standing in front of the same slide you show every quarter. Usage is up. Response time is down. Employees generated a great deal of output. Somewhere near the bottom sits a number claiming the whole thing was worth it.
Watch the executive’s face when you get to that number. They are not doubting your work. They are doubting the leap you asked them to take. You jumped from “we used it” to “the business got better” with nothing in between explaining how one produced the other. Ask them to sign off on that gap, and you are asking them to trust a story with missing chapters.
Deloitte’s 2026 enterprise research found that 66 percent of surveyed organizations had achieved productivity or efficiency gains from artificial intelligence (AI). Only 20 percent reported current revenue growth. That gap is why you should never let early productivity evidence stand in for completed financial value.
McKinsey’s 2026 measurement framework gives you a better move. It connects technical performance, adoption, operational indicators, strategic outcomes, and financial impact into one line of evidence. Five disconnected reports that never meet each other cannot do what one connected chain does. You need a defensible account of what changed, why it changed, what it produced, and what should happen next. You do not need a bigger dashboard.
You are probably measuring too late and asking too little
Look at when your measurement work starts. Most teams begin after the system is already running. You pull whatever the platform happened to track, active users, prompts submitted, documents processed, and you call it a scorecard.
Those numbers help you operate the workflow day to day. They were never built to explain why the company funded it in the first place. Nobody asked that question before the system went live, and you inherited the gap.
Here is the fix, and it starts earlier than you expect. “Employees spend too much time on research” is a feeling, not a problem statement. Compare that to “sales representatives need three days to research qualified accounts, causing delayed follow-up and missed meetings.”
That second sentence hands you a baseline before anyone builds anything. Research time, follow-up speed, meeting conversion, and opportunity creation all become measurable from day one. Write the strongest version of this sentence, and it never mentions a model, an assistant, or a platform.
Try this instead: “Qualified accounts receive delayed follow-up.” That describes a real operating weakness on its own terms. AI may or may not be the right answer to it, and your willingness to leave that open is itself a signal. Executives trust your business case the moment they can see you evaluated the problem before you fell in love with the tool.
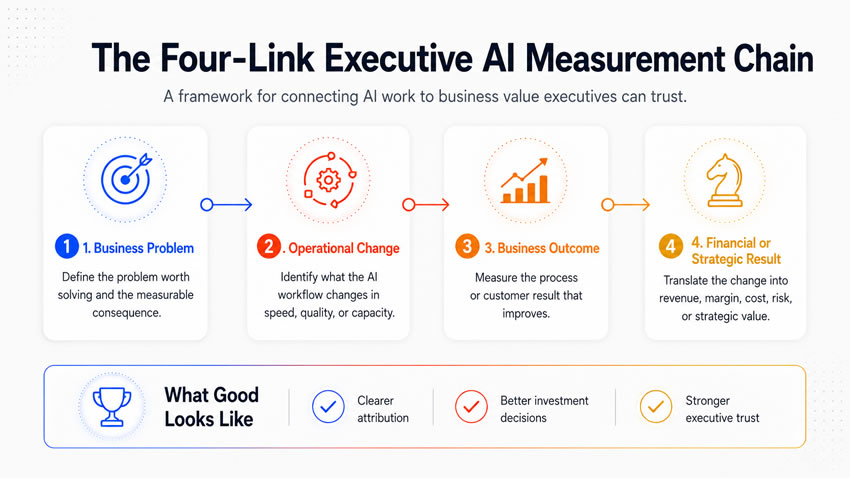
Walk them through the core thesis: trust is a chain, not a leap
Build your credible measurement system around four links. The business problem leads to the operational change the workflow was supposed to create. That change should produce a business outcome, and the outcome should justify a financial or strategic result.
Each link exists to explain the one after it. When you jump straight from system activity to a dollar figure, you have quietly skipped the two links that would have made the figure believable. Your audience feels that gap even when they cannot name it.
Take a service backlog you are trying to fix. The problem is resolution time running too long. The operational change is an assistant that summarizes case histories so agents spend less time gathering information before they act.
The business outcome is more resolved cases, fewer reopened ones, and shorter resolution time overall. The financial result is lower service cost and stronger retention. If you built this workflow to reduce churn, never let it earn approval on drafting speed alone. Drafting speed sits two links away from the reason you built it, and approving on that basis is approving on faith.
The first link you will show them: signals that the workflow is moving
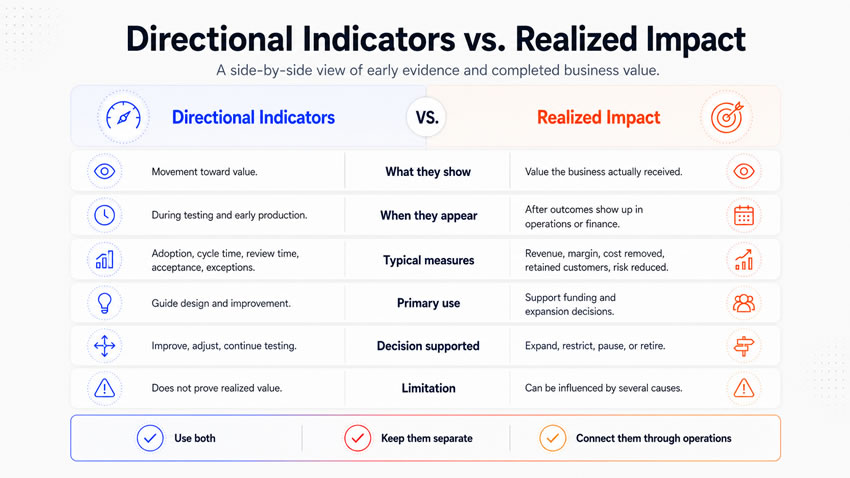
Bring your directional indicators first. They show up early, often during testing and the first weeks of production. They answer a narrow, honest question. Is the system reliable, are the right people using it, and does the output meet the standard it was built to meet?
Workflow penetration, output acceptance, review time, correction severity, exception volume, and employee confidence all belong here. These numbers help you make real decisions about design, training, and data.
Do not let them appear in a board deck labeled as value delivered. Positive movement on every one of them can still fail to produce a single dollar of business result. A directional indicator tells you something is working. It does not yet prove the investment paid off.
The second link: proof the value reached the business
Show them realized impact only once the workflow produces something observable: revenue received, cost genuinely removed, margin improved, capacity accepted, or risk events reduced. The right measure depends entirely on the original problem you named in week one.
Proving it takes more than a favorable trend. Revenue can rise because demand rose on its own. Service costs can fall because volume dropped for reasons that have nothing to do with your workflow.
Hold different categories of realized value to different discipline. Count revenue only after a completed transaction, never a pipeline or a meeting. Count cost as removed only once the company stops paying for something.
Treat estimated time savings as capacity, not savings, until you can show what filled that capacity. Make margin absorb the workflow’s complete cost alongside its benefit. Back avoided loss with a real historical incident rate, never the maximum theoretical exposure dressed up as a saving that already happened.
Give strategic value, faster market entry, sharper decisions, its own honest measure instead of a confident sentence in a memo.
The third link: what keeps the first two honest
Hold three controls together, and the whole chain holds. Match your attribution to the size of the claim you are making. Use controlled comparison and staggered rollout where conditions allow it.
Use matched cohorts and before-and-after analysis when they do not, and always name the other changes that might explain the same result. Let your language carry only as much confidence as the method earns. “Produced” needs real evidence behind it. “Associated with” should never get dressed up to sound like proof.
Put total cost beside every value claim you present: model usage, integration, human review, monitoring, governance, and the maintenance nobody budgets for after launch. A workflow can be genuinely good and still cost more than expected. Treat that finding as a reason to improve the workflow, not an automatic reason to kill it. Give leadership the whole picture before they decide either way.
Let ownership follow the evidence instead of collapsing onto one team. Technical owners answer for reliability. Workflow owners answer for adoption. Process owners answer for cycle time. Business owners answer for the outcome itself, and finance validates anything material before it reaches an executive review. No AI team should carry sole accountability for a result that operations and finance control.
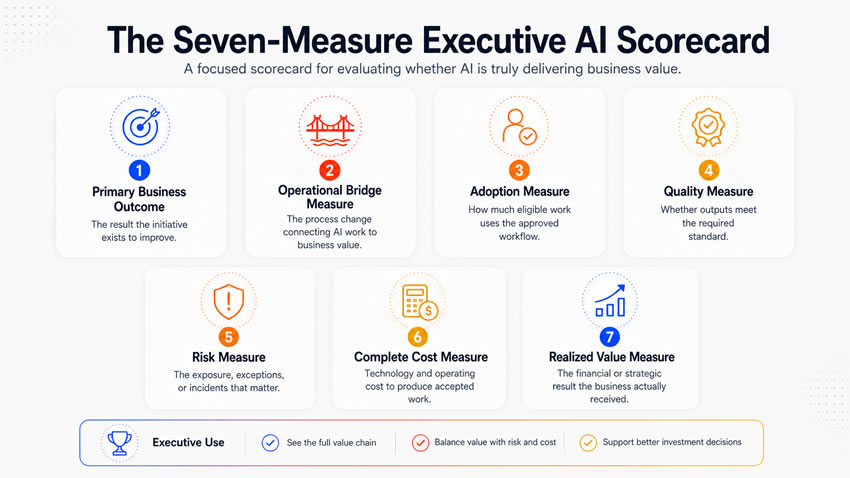
Give them seven measures, not thirty
Build a scorecard that holds seven measures, not every operational number your workflow generates. Choose one business outcome that explains why the workflow exists, and one bridge measure that shows how it gets there.
Add workflow penetration, rather than a raw user count, alongside one quality measure, one risk measure, one complete cost measure, and one realized value measure. Let your supporting teams keep deeper dashboards underneath this view. Your executive layer exists to preserve the connection across the whole chain, not to zoom in on the piece closest to the technology.
Attach a real threshold to every measure on that scorecard. A target, a warning level, a stop level, and a named person responsible for the response all belong to it. A number with no threshold is an observation that happens to be quantified, not evidence.
The same chain runs through every function, with different content
If you are building this for marketing, the problem is usually thin content relative to campaign demand. Track drafting time and acceptance as your directional indicators. Track qualified engagement and revenue contribution as your realized outcomes, not the volume of assets produced.
If you are building this for sales, the problem is delayed follow-up on qualified activity. Track meeting conversion and win rate as your realized outcomes, since research time alone shows capacity, not commercial progress.
If you are building this for finance, the problem is usually manual reconciliation eating specialist time. Include audit findings in your realized outcomes, because raw processing volume can quietly hide a growing exception queue behind it.
If you are building this for operations, the problem is usually inconsistent service across routine requests and exceptions. Remember that a fast classification means little if the request still sits waiting in another queue afterward.
If you are building this for human resources, the problem is usually administrative delay in recruiting or onboarding. Include retention and compliance in your realized outcomes, since a faster process that quietly lets fairness slip has not solved anything.
Adjust the evidence as the workflow grows up
At discovery, measure the current problem, cycle time, cost, and backlog, to decide whether intervention is worth attempting at all. In a pilot, measure operating viability, task performance, and early outcomes, to decide whether the design survives contact with real conditions.
In early production, measure stability and contribution, to decide whether results hold once your project team stops standing behind it personally. At expansion, measure realized value against the rest of the portfolio, to decide where capital belongs next.
A single measure can stay useful across every one of those stages. Its threshold, and the decision it triggers, should not.
Watch for the mistakes that erode trust fastest
Do not build a scorecard from whatever the platform already tracks instead of the business problem. That approach produces a report describing the tool, not the result. Do not convert every saved hour straight into labor savings. Time saved is only potential capacity until the business shows what filled it.
If you report generated output as completed work, you quietly hide how much of it survived review and reached real use. If you claim full credit for an outcome with several plausible causes, revenue and retention especially, you overstate a confidence the evidence never earned.
Two habits will erode your credibility faster than any of these. One is presenting directional progress as if it were realized impact. The other is producing a report with no decision attached to it. Both let a project protect itself instead of answering the only question that matters: whether it deserves more investment.
Bring eight questions into every evidence pack
Build a short, consistent pack, and it will strengthen every review it touches. What business problem did the investment address, and what was the baseline? What operational change did the workflow create?
What do the directional indicators show? What business outcome changed, and what financial impact has been realized? How confident is the attribution, and by what method? What did the complete workflow cost, including the work that never stops after launch?
Which decision should leadership make: expand, improve, restrict, pause, or retire? Name your own limitations and still reach a recommendation. Executives trust that far more than an analysis hiding behind certainty it does not have.
Run this 30-day process before your plan goes live
Week one. Define the business problem. Document the current condition, the affected population, the consequence, the baseline, and the accountable owner. Select one primary business outcome.
Week two. Map the operational change. Identify which tasks, decisions, or handoffs the workflow should alter. Select one operational bridge measure.
Week three. Build the evidence chain. Choose directional indicators, realized-impact measures, cost measures, and risk measures. Settle the attribution method and data source for each.
Week four. Set the management rules. Define targets, thresholds, decision gates, owners, and a reporting cadence. Review the complete plan with finance and business leadership before it goes live.
A short measurement plan gets used. A long metric catalog gets ignored, and an ignored catalog fails as completely as no plan at all.
What you tell them at the end
A scorecard that jumps from activity straight to dollars asks an executive to trust a leap the evidence never made. A scorecard built on the chain asks for something smaller and considerably more durable. It asks for trust that your company can show its own work.
Connect one link to the next, from the original problem to the value it produced. The organizations still earning investment in 2026 are the ones whose measurement can survive a skeptical question asked out loud in the room. A polished slide stopped being enough the moment everyone realized how easy a slide is to make.